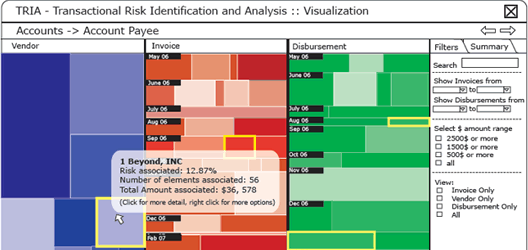
Interactive treemap visualizations
DURATION: 16 weeks
GUIDE: Dr. Mave Houston, PwC LLP
PROJECT BACKGROUND
I did this project as part of my internship at Centre of Advanced Research, PricewaterhouseCoopers LLP. I worked for Project Sherlock which is developing new techniques for detecting risks of accounting fraud or error based on the detailed analysis of corporate financial data. As interface specialist intern I designed and created prototype of UI to facilitate analysis of large quantities of transactional data.
APPROACH
I designed interactive visualizations to help investigators build insights by identifying patterns in large quantity of transactional data. Existing risk identification and analysis tool had major shortcomings in usability and did not provide users with an overall view of the data. I conceptualised an adapted treemap visualization which provided an overview of the data and let investigators drill in and get more details to refine and evaluate their hypothesis. Several design iterations of proposed visualizations were done based on feedback. I also built a high fidelity prototype in JAVA which was tested on multiple users. PwC is in the process of obtaining a patent.


